In JavaWorld recently, an article about the "Big Promise of Big Data" :
http://www.javaworld.com/javaworld/jw-09-2010/100914-big-data.html
It's a nice overview of what's happening in the world of Big Data, and where to look further for information.
Thursday, September 30, 2010
Tuesday, September 21, 2010
The Atlantic Tech Canon
This week in The Atlantic, Alexis Madrigal lists 50 books and films that purportedly constitute a "Tech Canon." Madrigal constructed the list with starting with over 200 suggestions from tech writers and scholars, then whittled it down to the final 50. Covering written fiction and nonfiction as well as film, the list includes old standbys like Fred Brooks' _The Mythical Man Month_ and William Gibson's _Neuromancer_. However the list also includes books like Orson Scott Card's _Ender's Game_, which is perhaps lesser known to the non-science-fiction-reading public, but thought to have been an influence in the creation of the fictional universe in which the bestselling video game "Halo" takes place.
As with any list, there are arguments to be made for and against each choice. I must say that personally I was surprised by the thoughtful case made for the inclusion of "Star Trek II: The Wrath of Khan" on the list.
Check out the list on the Atlantic site at:
The Atlantic Tech Canon - Alexis Madrigal - Technology - The Atlantic
Wednesday, August 18, 2010
Swingly -- A search engine that answers your questions
SearchEngineLand has an article about a new search engine called "Swingly" that answers your questions directly rather than giving you a list of sites where you might find the answer.
Swingly does well at certain kinds of questions like "What was the first video on MTV?" However, Swingly could not answer the logical inverse of that question. When asked, "Why are the Buggles important in music history?" Swingly's answer was less than satisfactory. However, this "why" question is more subjective than the question that preceded it.
Swingly does well at certain kinds of questions like "What was the first video on MTV?" However, Swingly could not answer the logical inverse of that question. When asked, "Why are the Buggles important in music history?" Swingly's answer was less than satisfactory. However, this "why" question is more subjective than the question that preceded it.
Thursday, August 12, 2010
Google and Bing Catch-up
Good piece in the NYTimes recently about how Google is constantly adjusting to the challenges posed by Bing, Microsoft's search engine.
http://www.nytimes.com/2010/08/02/technology/02google.html
http://www.nytimes.com/2010/08/02/technology/02google.html
Friday, July 2, 2010
How Google Works
PPC Blog has produced a great new graphic entitled "How Google Works." Since they have given blanket permission to include this image on other web sites, I went ahead and pasted it in below. Check it out--it's a great nuts and bolts overview of what happens with Google search. You can view the full size version here.
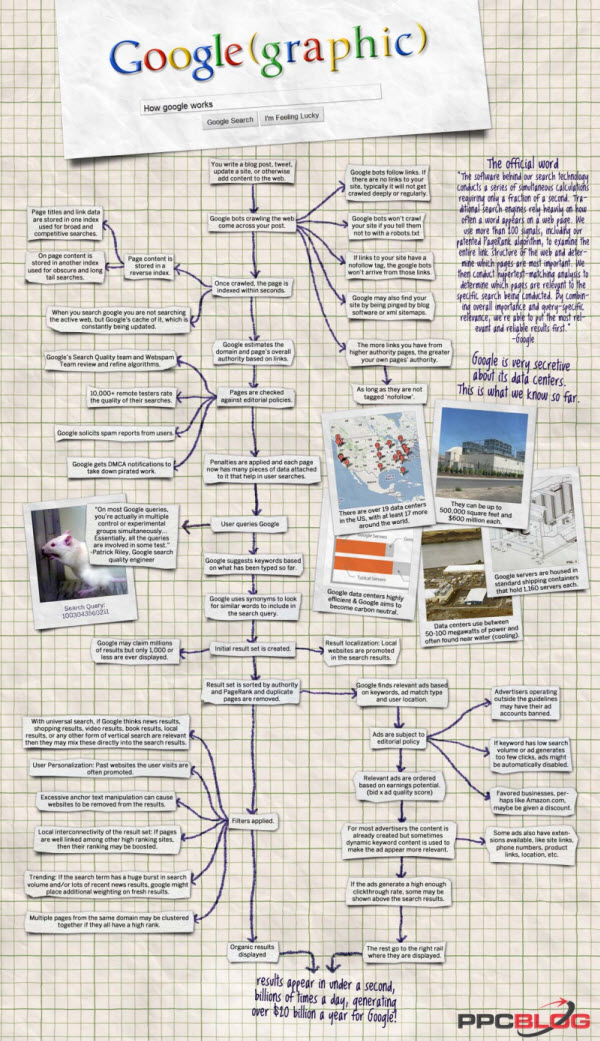
Infographic by PPC Blog
Infographic by PPC Blog
Monday, May 10, 2010
"Big Data"
Ok, so it turns out that someone has coined a term for the "tsunami of data" that has been mentioned a few times in this blog: "Big Data." The term refers to the large amount of data in the stores of corporate and government entities as well as the software and services that capitalize on it.
To read more about Big Data, check out this article from ZDNet:
http://www.zdnet.com/blog/virtualization/what-is-big-data/1708
To read more about Big Data, check out this article from ZDNet:
http://www.zdnet.com/blog/virtualization/what-is-big-data/1708
Thursday, April 15, 2010
Surprising economic indicators
In the article “New Ways to Read the Economy” in the Wall Street Journal last week, journalist Cari Tuna quotes several economists who are looking at new and surprising data sources to determine levels of economic activity. For example, Ted Egan, the chief economist in the San Francisco Union Square University of California , looks at diesel fuel sales on California
It's heartening to hear about people using data like this to solve problems at a time when we hear a lot about the "tsunami of data" going unharvested. (See blog entry on this).
It's heartening to hear about people using data like this to solve problems at a time when we hear a lot about the "tsunami of data" going unharvested. (See blog entry on this).
Friday, April 9, 2010
"SuperCrunchers" referenced in Daily Beast article
An article in the Daily Beast, "How Visa Predicts Divorce" , discusses how credit card companies use data mining techniques to determine if a person is more likely to get a divorce. The author of the article mentions that this technique was discussed in the book SuperCrunchers, which I reviewed in this blog a while back.
A snippet from the article: "By scrutinizing your purchases, credit companies try to figure out if your life is about to change—so they’ll know what to sell you."
A snippet from the article: "By scrutinizing your purchases, credit companies try to figure out if your life is about to change—so they’ll know what to sell you."
Thursday, April 8, 2010
Bing and baseball
The latest post on the Microsoft Search blog describes how Bing adds value to the results of Major League Baseball related searches. Search for your favorite team and you will see the latest win/loss results, a schedule for upcoming games, and a one line summary of standings. Bing also provides real-time results for current games. Search for your favorite player and you will see a picture along with a table of their stats for the most recent game and a one line summary of their stats for the season.
In comparison, when you search your team in Google, you will see an inning scorecard of the most recent game. Also Google currently has nothing comparable to the MLB player results offered by Bing.
In comparison, when you search your team in Google, you will see an inning scorecard of the most recent game. Also Google currently has nothing comparable to the MLB player results offered by Bing.
Monday, April 5, 2010
iPad and Gutenberg
For a thoughtful rumination on the possible effects of digital media on society (in light of the recent release of the iPad), see today's entry in the Paper Cuts blog at the New York Times.
There's also another article in the same vein from the Arizon Republic entitled "iPad, Kindle and other e-reader technology book business."
There's also another article in the same vein from the Arizon Republic entitled "iPad, Kindle and other e-reader technology book business."
Thursday, March 11, 2010
Google Public Data Visualization
In a previous post, I mentioned Google's public data feature, which allows users to explore publicly available data sets from sources such as the World Bank.
Now Google has amped up this feature with some new visualization tools. Google calls this set of tools the "Public Data Explorer," and states that now "students, journalists, and everyone else can play with the tool to create visualizations of public data, link to them, or embed them in their own web pages."
You can read the announcement from Google here.
Saturday, March 6, 2010
Going to see Tufte
Edward Tufte, pioneer in the field of information visualization and author of such books as "The Visual Display of Quanititative Information," will be coming to Philly to do one of his famous one day courses. I registered as soon as I saw he was coming.
Not to be a shill for the guy, but here's the information on his upcoming courses
I'll let you know how it goes.
Not to be a shill for the guy, but here's the information on his upcoming courses
I'll let you know how it goes.
Sunday, February 14, 2010
SuperCrunchers by Ian Ayres
There is a lot of data out there.
This fact has urged a few related notions to propagate from the realm of research into the world of business and the popular consciousness. The first such notion is that the amount of data out there is a bit frightening – there is a tremendous, staggering amount of it residing in the digital storehouses of government and industry, and it is growing bigger every minute. The second notion is that there is a desperate need to harness this data both for the betterment of society and the growth of business. The third is that this desperate need is starting to be met by emerging disciplines, tools, and methods.
I can tick off several books that reside in one or more of the above categories. “Beyond the Tsunami,” an online book from Microsoft Research mentioned in a post in this blog, is one such book. “Visualizing Data,” a title from O'Reilly Press, falls into the the third category.
But the book I want to talk about now is “SuperCrunchers,” a 2007 book by Ian Ayres, a professor at both the Yale School of Law and the Yale School of Management.
SuperCrunchers is a book about how statistical analysis of large datasets (that is, “supercrunching”) is beginning to profoundly affect our lives. The book illustrates this effect with a series of anecdotal case studies. In one example, a computer science professor started the website farecast.com after he was annoyed by learning that the people in the seat next to him on a plane had paid less for their tickets simply by waiting longer before buying them. Farecast is a site that predicts when tickets for your desired flight will be cheapest.
Ayres also describes the application of statistical methods to societal problems in the fields of medicine (evidence based medicine) and education (direct instruction). The sometimes innovative and sometimes creepy use of such methods by large corporations are detailed by Ayres as well.
The anecdotes contained in this book are compellingly written, and since the book is for a popular audience, the statistical methods described are described easily digested by the average reader.
This is an important book—-it clearly describes how the abundance of data and the statistical methods to manipulate it are changing society. This change is sometimes clearly for the better, and sometimes less so.
Monday, February 8, 2010
Google translator phone; CNN interviews Google policy analyst
An article in the Australian Herald Sun (and noted in the Beyond Search blog) states that within a few years Google will have a working translator phone. Yes, you heard right. You speak English, and the guy on the other end hears Mandarin (or French or...). This is, as Beyond Search noted, a very Star Trek-y advance in communications.
In other news, CNN interviewed Derek Slater, a policy analyst at Google about universality of access and the benefits of improving broadband in the U.S.
In other news, CNN interviewed Derek Slater, a policy analyst at Google about universality of access and the benefits of improving broadband in the U.S.
Tuesday, January 19, 2010
Google, public data, and visualization
Google offers a recently added feature (discussed on the Google blog in April here) that allows for both searching and visualization of public data.
There is no special doorway to this data; just search on "unemployment rate Philadelphia" (for example) in the plain old Google search box. The first link in the result list will be accompanied by a chart illustrating the latest data for your search.
When you click the link, however, you are taken to a larger interactive chart where you can compare the unemployment rate in Philadelphia with the rate in other cities and states.
The Google blog states that the visualization aspect of the public data search comes through their acquisition of Trendalyzer, a program that enabled the animation of statistical data.
Friday, January 8, 2010
Librarians and Programming Skills
A recent article in Research Information (and referenced on the LISNews blog as well as the ResourceShelf Blog) talks about transforming the role librarians through their acquisition of programming skills.
One point that author David Stuart makes in the article is that librarians are still somewhat bound to the concept of "document," even in an age where the web abounds with all kinds of "structured data" that is not necessarily in a "document" format per se. Stuart believes that if librarians had the right technical skill sets, they could make this data available to their patrons through the use of programming APIs and mashup tools such as Yahoo Pipes. In particular they could integrate it into the result sets of an open source ILS or OPAC.
I think this is a great point. Librarians, especially at academic institutions, are moving away from being guides to stacks of paper books toward being gatekeepers of digital resources, subscription or otherwise. It's exciting and quite fitting to consider librarians as imaginative data aggregators -- using technical skills to combine data from different sources into a result portfolio for a patron or selected audience -- for example, engineers or humanities students.
Check out the article -- it's a great read!
Subscribe to:
Posts (Atom)